Light Pollution and the Night Sky
Understanding the impact, measuring darkness, and protecting the stars
“We’ve pulled the stars from the skies and brought them down to Earth, but at what cost? When we turn on all these lights, we’ve lost something precious…the stars.“ – Neil DeGrasse Tyson
Light Pollution & Its Impacts
What Is Light Pollution?
For most of human history, the phrase “light pollution” would have made no sense. Imagine walking toward London on a moonlit night around 1800, when it was Earth’s most populous city. Nearly a million people lived there, making do with candles, rushlights, torches, and lanterns. Only a handful of homes had gas lighting, and it would be another seven years before public gaslamps lit the streets. From a few miles away, you were as likely to smell London as see it.
Today, most of humanity lives under intersecting domes of reflected and refracted artificial light — scattered by cities, highways, suburbs, parking lots, and industrial zones. Nearly all of nighttime Europe is a nebulous glow, as are the eastern U.S., coastal China, and all of Japan. In the south Atlantic, the metal halide lamps used by squid fishing fleets burn so brightly they outshine cities like Buenos Aires when viewed from space.
In most modern cities, the night sky appears empty — its stars erased by a haze of sodium and LED glare. We’ve grown so accustomed to this pale glow that few people realize the true darkness of an unlit night can be so profound that Venus alone can cast shadows. Above that glowing ceiling lies the cosmos — unchanged, undiminished, waiting — but obscured by the light we waste.
Impacts on Astronomy and Beyond
The consequences of light pollution extend far beyond astronomy. For visual observers and astrophotographers, skyglow limits contrast, obliterates faint details, and makes dark-adapted viewing nearly impossible. Even with advanced filters and imaging gear, light pollution raises the noise floor and complicates data acquisition, requiring more processing and tighter calibration.
But it’s not just astronomy that suffers. Poorly shielded artificial light disrupts circadian rhythms in humans and animals alike. It can interfere with melatonin production, affect sleep quality, and has been linked to various health issues. Wildlife — especially nocturnal species — experience disrupted mating, feeding, and migration cycles due to excessive nighttime illumination.
Tips for Astrophotographers
Even under light-polluted skies, there are techniques and tools that can improve results:
• Use narrowband filters (Hα, OIII, SII) for emission nebulae — these reject most unwanted wavelengths.
• Target objects when they are highest in the sky to reduce the amount of atmosphere and light pollution you’re imaging through.
• Avoid imaging near the Moon unless doing lunar/planetary work or broadband star clusters.
• Use physical shielding (tarps, walls, or dew caps) to block nearby light sources and improve contrast.
A Personal Perspective
At Mesa Vista Observatory, I’m fortunate to live under relatively dark skies in northern New Mexico. While not pristine, these skies offer a vastly better experience than those available near large metro areas. Still, even here, the distant glow of Santa Fe or Albuquerque is visible on the horizon.
To help quantify and monitor sky conditions, I’ve installed a Sky Quality Meter (SQM-LE) near the observatory. The data it provides allows me to track changes in sky brightness over time and better plan imaging sessions around the darkest conditions. Live graphs from the SQM-LE appear below for those interested in following the light levels at my site.
The Bortle Scale
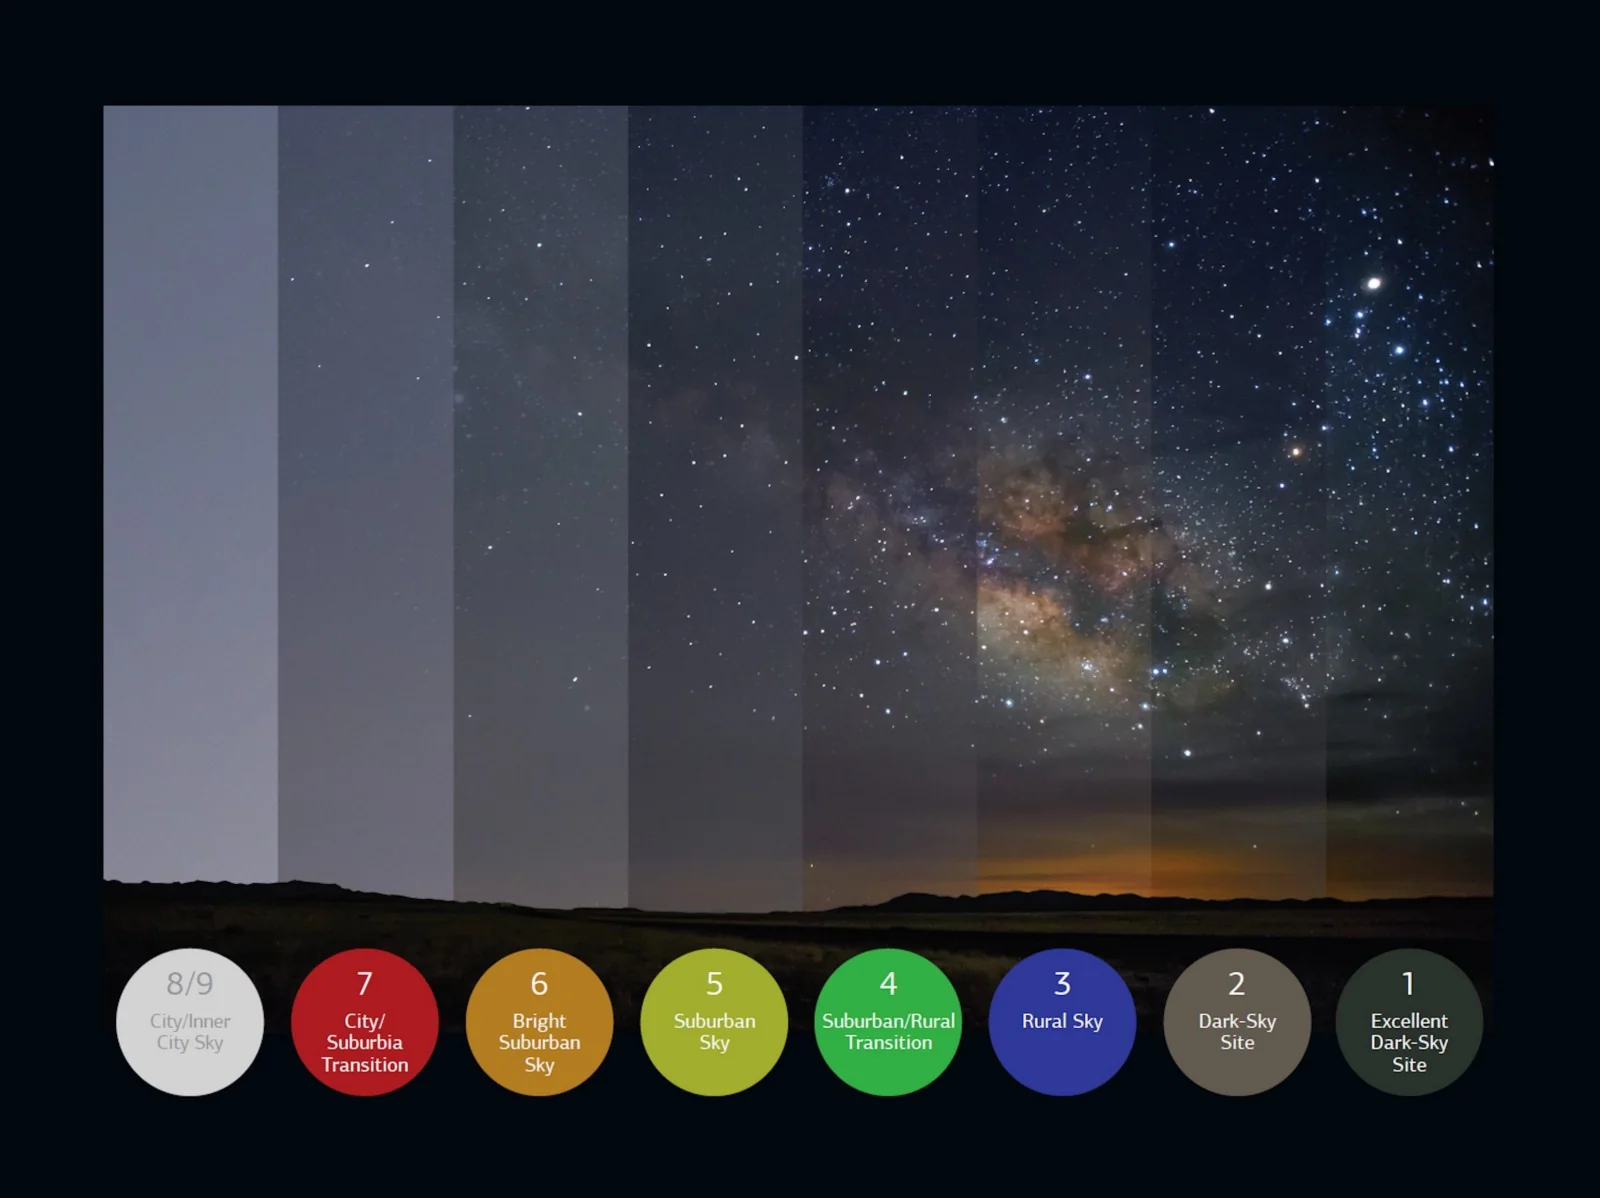
Understanding the Bortle Scale
The Bortle Scale is a nine-level numeric scale that measures the night sky’s brightness and the visibility of celestial objects, especially from the perspective of amateur astronomers. At Class 1, skies are pristinely dark — the Milky Way casts shadows, and zodiacal light is clearly visible. At the other extreme, Class 9 skies are found in the heart of large cities, where only the Moon, planets, and a handful of the brightest stars pierce through the orange haze.
Each class not only describes the number of visible stars, but also the sky’s background glow, visibility of deep-sky objects, and how much light pollution interferes with dark adaptation. It’s a useful reference when comparing observing conditions from one location to another — especially when planning astrophotography.
Mesa Vista’s Skies
Mesa Vista Observatory typically enjoys skies in the Bortle 2–3 range, depending on seasonal and atmospheric conditions. That’s significantly darker than most metropolitan or suburban areas and allows for excellent visual and photographic observing — though it still isn’t completely pristine. Faint skyglow from Santa Fe or Albuquerque may be visible on the horizon during certain nights, but the overhead sky remains impressively dark.
To see how this area compares with others around the world, explore the interactive light pollution map below:
👉 Explore the Light Pollution Map to find out how dark your skies are.
Tracking Darkness at Mesa Vista Observatory
🌌 Latest Realtime Reading
This live-updating image shows the most recent sky darkness reading taken by the observatory’s Sky Quality Meter (SQM).
The number shown is in magnitudes per square arcsecond — a standard way to measure how dark the night sky is.
It also displays the Naked Eye Limiting Magnitude (NELM), which estimates the faintest star you could see without a telescope under those sky conditions.
Readings change with weather, Moon phase, and nearby light — so this gives a real-world snapshot of how dark the sky is at any given moment.
In short: the darker the sky, the higher these numbers will be.
📈 Latest MPSAS Graph
This graph shows how dark the night sky is, measured in magnitudes per square arcsecond — a standard way astronomers rate sky brightness.
Higher numbers mean darker skies (a reading above 20.00 is considered good).
The chart updates every 15 minutes with real-time data from the observatory.
You’ll also see the Moon’s phase and altitude, which can make the sky brighter.
Clouds and weather can reflect light back down and make the sky appear brighter, even if the Moon isn’t out.
In short: the higher the number, the better the stargazing!
👁 Naked Eye Limiting Magnitude (NELM)
This chart shows the Naked Eye Limiting Magnitude, or NELM — a measure of how faint a star you can see without optical aid under current sky conditions.
Higher numbers mean darker skies and better visibility of faint stars.
At Mesa Vista Observatory, typical NELM values range from 6.5 to 7.0, depending on time of night, transparency, and other factors like humidity or wildfire smoke.
Even here, distant light domes from Santa Fe or Albuquerque can influence the horizon glow slightly, but overall the skies are excellent by most standards.
For context, NELM 6.0+ is considered a dark sky, while heavily light-polluted cities like Albuquerque or Phoenix often experience NELM values around 3.0, where only the brightest stars are visible.
This graph offers a real-world glimpse into how light pollution affects what the naked eye can observe at night.
🌒 What You Can Do to Fight Light Pollution
Even small changes can help restore the beauty of the night sky. Here’s how you can make a difference — starting at home:
- 🔦 Shield your outdoor lights to aim light downward, not into the sky
- 🕒 Use motion sensors and timers so lights are only on when needed
- 💡 Choose warm-tone LEDs instead of harsh blue or white lights
- 🗣️ Talk to neighbors about simple steps to reduce unnecessary lighting
- 📜 Support dark sky ordinances and responsible lighting laws in your area
© 2025 Enchanted Astronomy. All rights reserved.